What is dasymetric mapping? Redistributing census counts to where people live
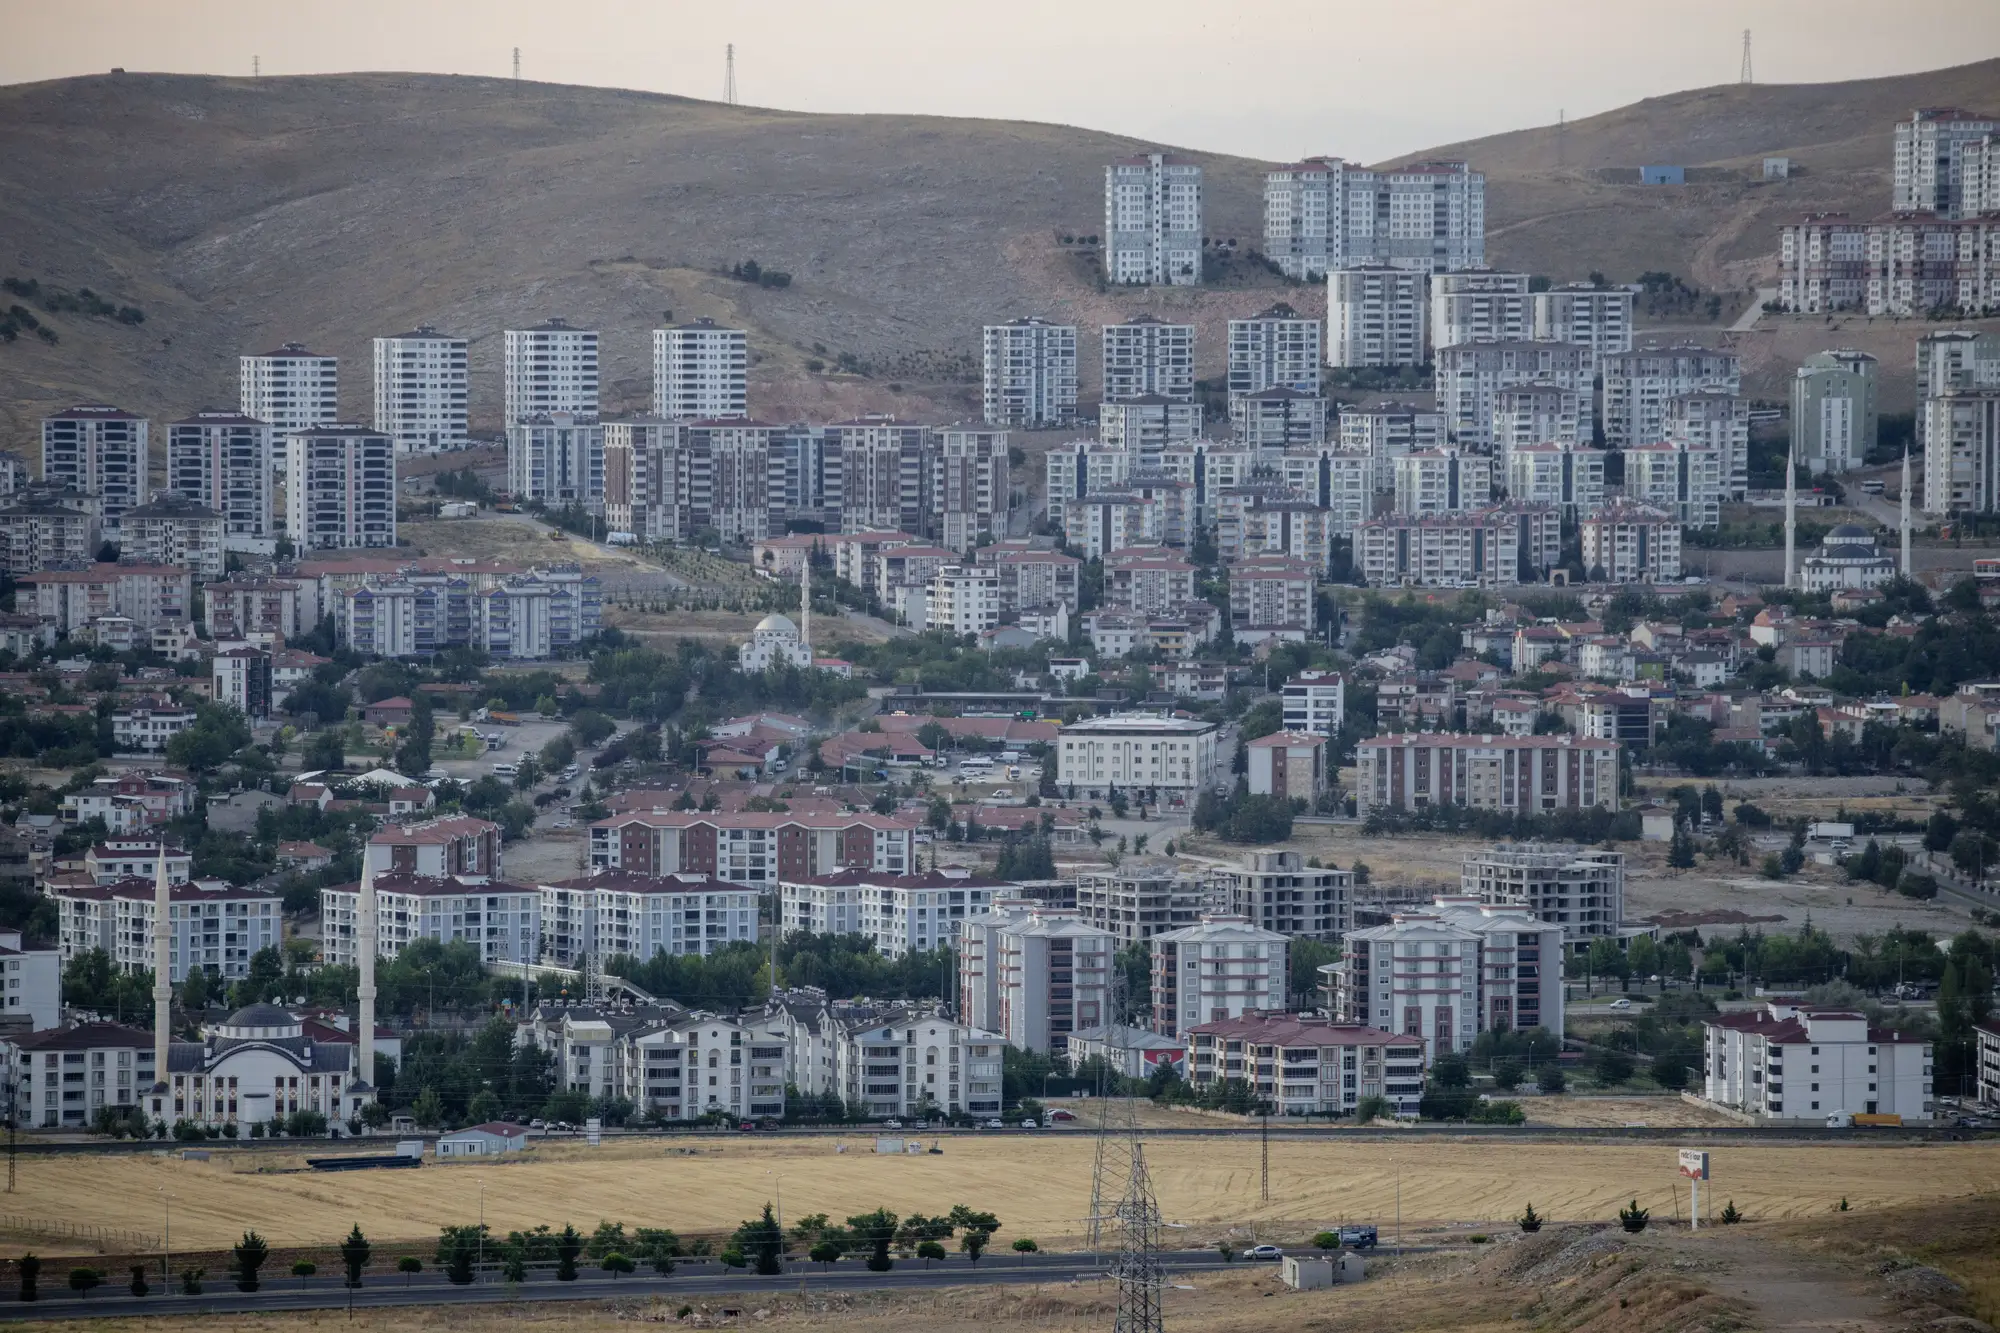
If you've worked with gridded population products, you've probably run into the term without anyone stopping to define it. Dasymetric mapping is the technique that takes a population count tied to an administrative zone, a census tract, an enumeration area, a ward, and redistributes it within that zone according to where people actually live, rather than spreading it evenly across the whole polygon.
The word comes from Greek roots meaning "density measurement," and the core idea is older than satellite imagery. Cartographers were doing crude versions of this in the 1930s, shading maps to reflect population concentration instead of just drawing choropleth fills bounded by administrative lines. What's changed is the ancillary data available to do the redistribution, and that's the part worth understanding if you're producing estimates for a district between census rounds.
The problem with choropleth population maps
A standard choropleth map takes your enumeration area's total population and applies it uniformly across the polygon. A tract of 40,000 people covering 12 square kilometers gets treated as if those people are spread evenly over every hectare, including the river frontage, the industrial park, and the half of the tract that's still scrubland. Anyone who has tried to use a choropleth population layer for facility planning or service delivery knows this produces nonsense at the local scale. The density figure is correct as an average. It's wrong everywhere you need a number.
Dasymetric mapping fixes this by bringing in a second layer, ancillary data that tells you something about where the population is likely concentrated, and using it to constrain or weight the redistribution.
How the redistribution works
The simplest version is binary dasymetric mapping. You mask out land cover classes where nobody lives, water bodies, forest, bare rock, and redistribute the full population only across the remaining built-up footprint. That's a meaningful improvement over uniform spreading, but it still treats every square meter of built-up land as equally populated, which isn't true once you have a mix of single-story housing, mid-rise apartment blocks, and commercial strips in the same tract.
The more useful version weights the redistribution using finer ancillary variables: built-up area extent, individual structure counts, and building-height or floor-count estimates where you can get them. Instead of apportioning the tract's population by footprint area alone, you apportion it by a combination that approximates floor space, which tracks occupancy far better than footprint area does. A city block of five-story apartment buildings and a block of single-story houses can have near-identical built-up footprints and wildly different populations. Height data is what separates them.
This is the method behind most of the gridded population products statistics offices now use for small-area estimates and for filling the gap between census years. You keep the census-year total for your reporting zone as the control, so the method doesn't invent population, it only changes where within the zone that population gets placed. For inter-censal years, the same logic extends forward. If the built-up footprint, structure count, and estimated building heights for a fast-growing district have visibly changed since the last count, you have a defensible basis for updating the distribution and the total ahead of the next census.
Where it breaks down
Dasymetric mapping is only as good as the ancillary layer feeding it. If your built-up area classification is stale or your structure count misses infill construction, the redistribution inherits that error. It also assumes a reasonably stable relationship between built form and occupancy, household size, vacancy rate, which can shift during rapid growth or displacement. None of that makes the method wrong. It means the ancillary layers need to be current and the household-size assumptions need to be stated, not buried.
If your reporting zone has grown faster than your last enumeration can account for, our structure counts and building-height layer give you an updated base for exactly this kind of redistribution, the building blocks for an inter-censal estimate you can defend to your board.