A population estimate for the years between censuses.
Structure counts, built-up area and building height from satellite imagery, converted into a figure per enumeration area with the assumptions written down.
The files
A pilot delivers one district, for the year you name.
| File | Format | What's in it |
|---|---|---|
| Built-up area layer | GeoPackage | Polygons for settlement extent over your boundary, with hectares per enumeration area. The layer is dated to the image it was mapped from. |
| Structure count | CSV and GeoPackage | Detected structures per enumeration area or admin unit, keyed to your area codes. The GeoPackage holds the detected footprints, so you can see what was counted. |
| Building height | GeoTIFF | Height in metres where the imagery allows it, with the cells where it doesn't left empty. Used in the conversion where it is available. |
| Population estimate | CSV and GeoPackage | The estimate per enumeration area, admin unit or grid cell. Every row carries the structure count, built-up area and the persons-per-dwelling assumption that produced it. |
| Methodology note | PDF | How structures and height were turned into people, the assumptions used, the image dates and the gaps. Written to sit next to the published figure as an annex. |
How it works
You supply
Supply the area
Send your admin boundary or the enumeration area polygons from the census frame, and say which year you want the estimate for.
We run
Imagery check
Before mapping, the available very high resolution passes over the district are checked for date and cloud. You hear what is usable before anything is run.
Map the structures
Built-up area and structures are segmented in the imagery. Height is derived where the imagery supports it.
Convert to people
Structure and height signals are turned into an estimate using conversion assumptions that are set with your demographers and recorded.
Comes back
Hand-over
Layers, tables and the methodology note, in formats that open in QGIS or ArcGIS and join to your area codes.
Limits
| Condition | Effect on the output |
|---|---|
| Cloud sets the date | A clear daylight pass is needed. The estimate is tied to the image date, and a cloudy season over a district can delay it. |
| Half a metre is the floor | At 0.5 m a small dwelling is a handful of pixels across. Dense roofs that touch may be counted as one structure, and shacks under tree cover or a shared roof can be missed. The note says where. |
| A structure is not a household | A building may hold one family or many, or may be a shop, a shed or empty. The conversion to people is an assumption, and the estimate is only as good as that assumption. |
| Height needs the geometry | Building height comes from the imagery where the viewing geometry allows it. Elsewhere the cell is empty and the conversion uses structure count alone. |
| Not continuous | Estimates are made per project for a date you choose. There is no rolling feed. |
| Not a census | The output does not replace an enumeration. It bridges the years between two. |
Why this exists
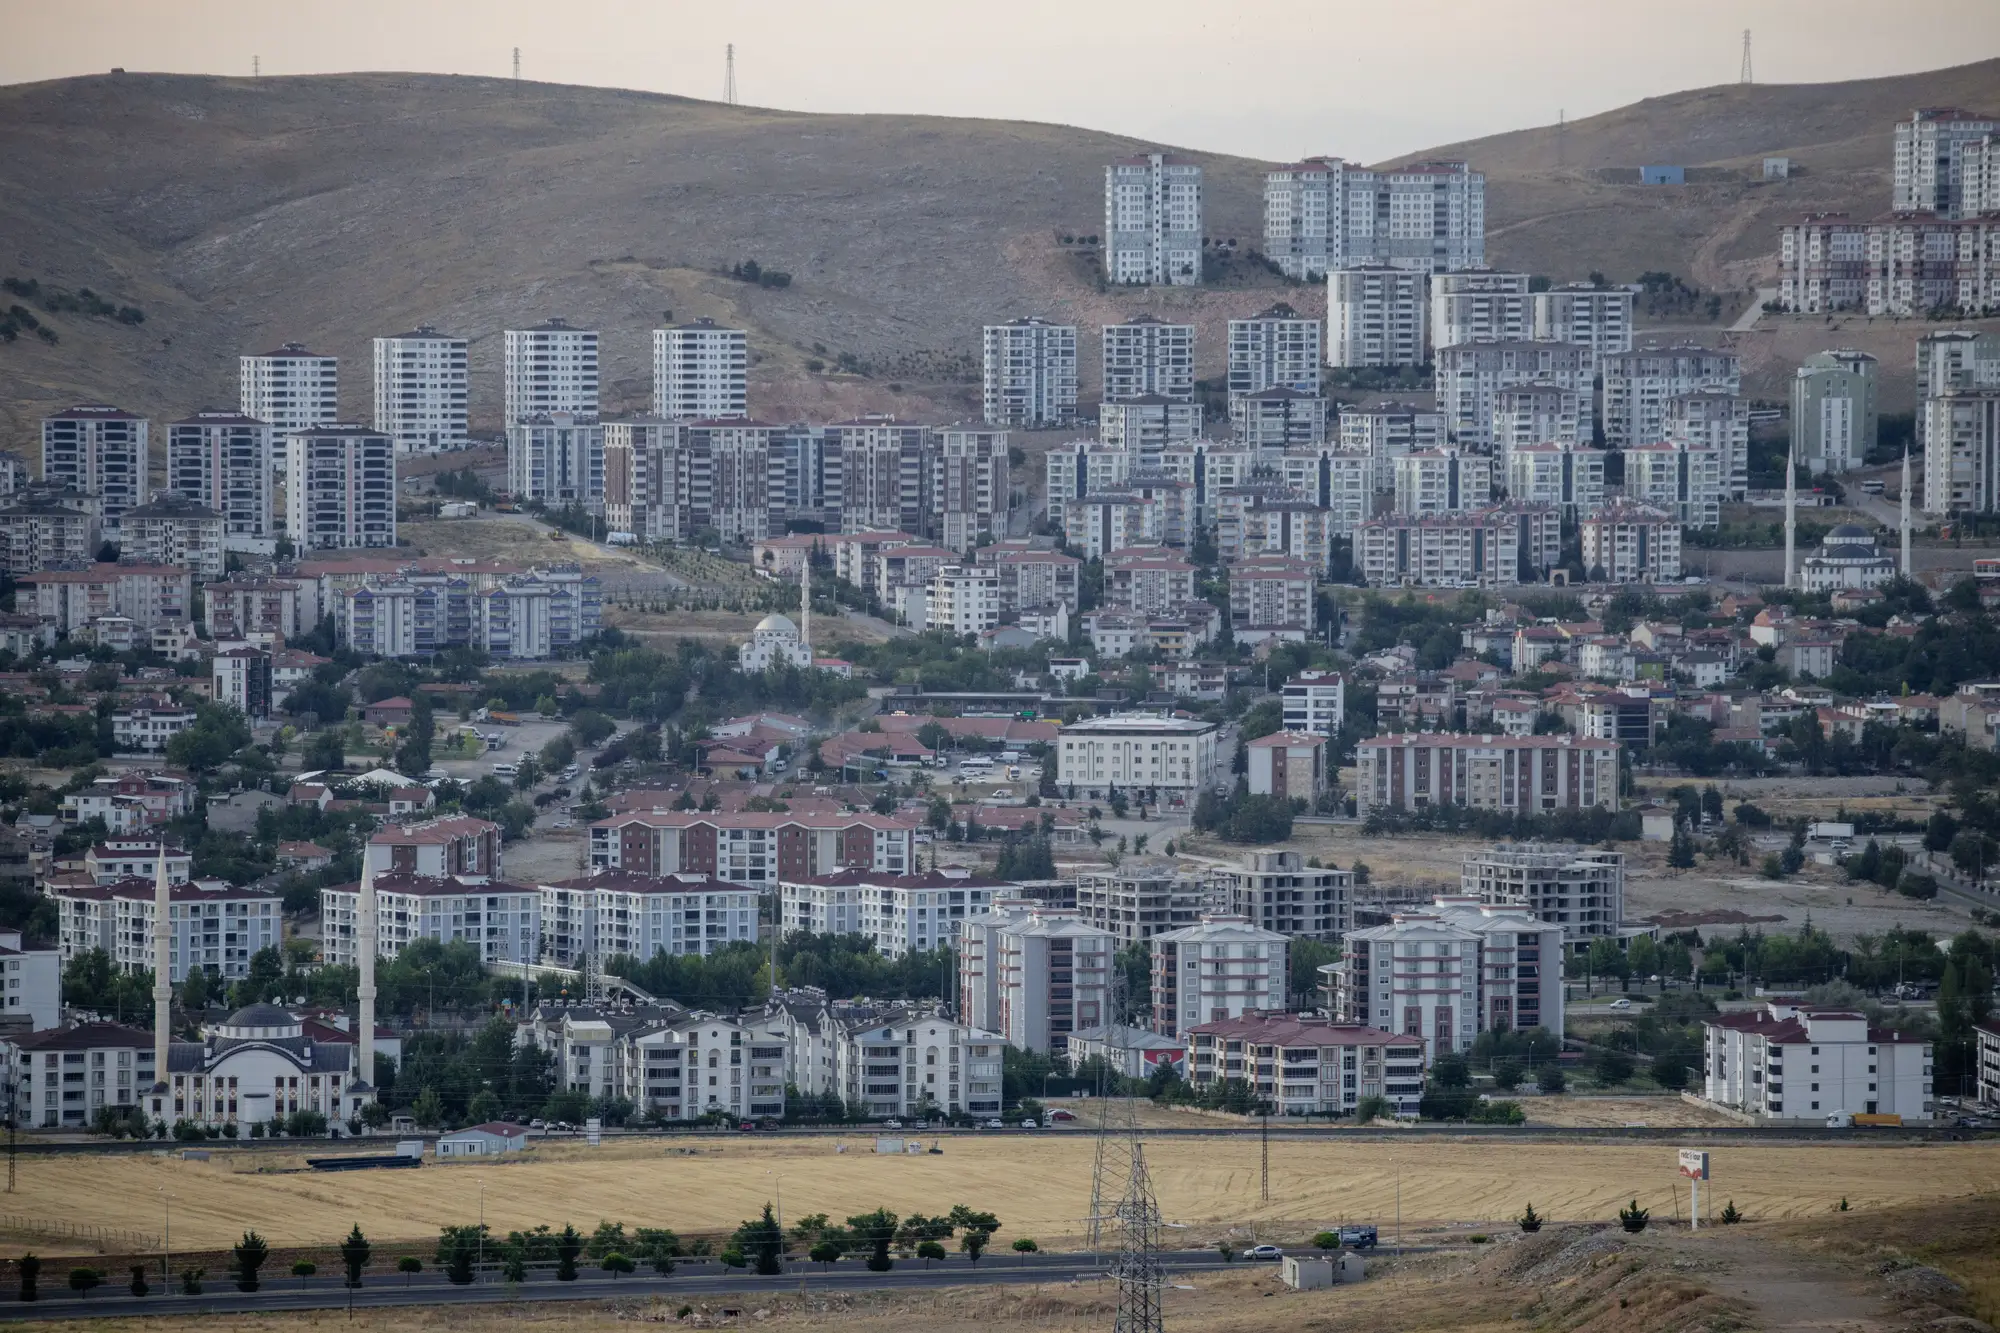
Between censuses the district figure is a projection, rolled forward from the last count. In a fast-growing district the new estates and informal edge outrun the migration assumption, and the registers that might show it lag. When the district disputes its allocation, the office has a projection to defend and no fresh evidence, unless it pays for a household listing. This gives the demographer something observed from above to set beside the projection.
Who it's for
For
- Demographers at national statistics offices who need a figure for a district between census rounds and want to see the assumptions behind it.
- Population projections teams who would check the projection against a structure-based estimate.
- Humanitarian planners who need a settlement-extent baseline where the last count is old or missing.
Not for
- Teams that need a headcount of named people. This is a structure-derived estimate.
- Replacing a census or a household survey.
- Real-time or continuous population tracking.
- Building-by-building occupancy, or a single dwelling's household size.
Technical and procurement questions
How does a structure count become a population?
Counts and heights are converted with documented persons-per-dwelling assumptions. You can set them from your own survey data, and every output row carries the assumption used. It is an estimate, not a headcount.
What do you need from us?
An admin boundary or the enumeration area polygons, and the target year. If you hold a recent household listing for part of the district, send it, because it is the best thing to check against.
How do we validate it against our own data?
Compare the structure counts and the estimate with a recent household listing, a survey round or register data for a few enumeration areas. Your own figures are the test.
Does it replace the census?
No. It is for the years between rounds, and it can also support frame updating.
What resolution does it need?
Imagery at 0.5 m or finer. Coarser imagery makes small dwellings too few pixels to count.
What about cloud?
A clear daylight pass is needed, so timing follows imagery availability. The imagery check at the start tells you what is usable.
How often can it refresh?
When you commission it, between censuses. There is no continuous feed.
Who owns the outputs, and how is it bought?
Use and ownership terms for the delivered files are set in the contract before work starts. Each pilot is scoped and quoted on its own, with a written scope you can take through procurement.
Send the district boundary and we'll tell you what imagery is usable.
Or .