Urban infill vs. horizontal sprawl: why it changes a population estimate
When a district's population is reviewed between two census rounds, the biggest source of error usually isn't the headcount method. It's the assumption about how the place grew.
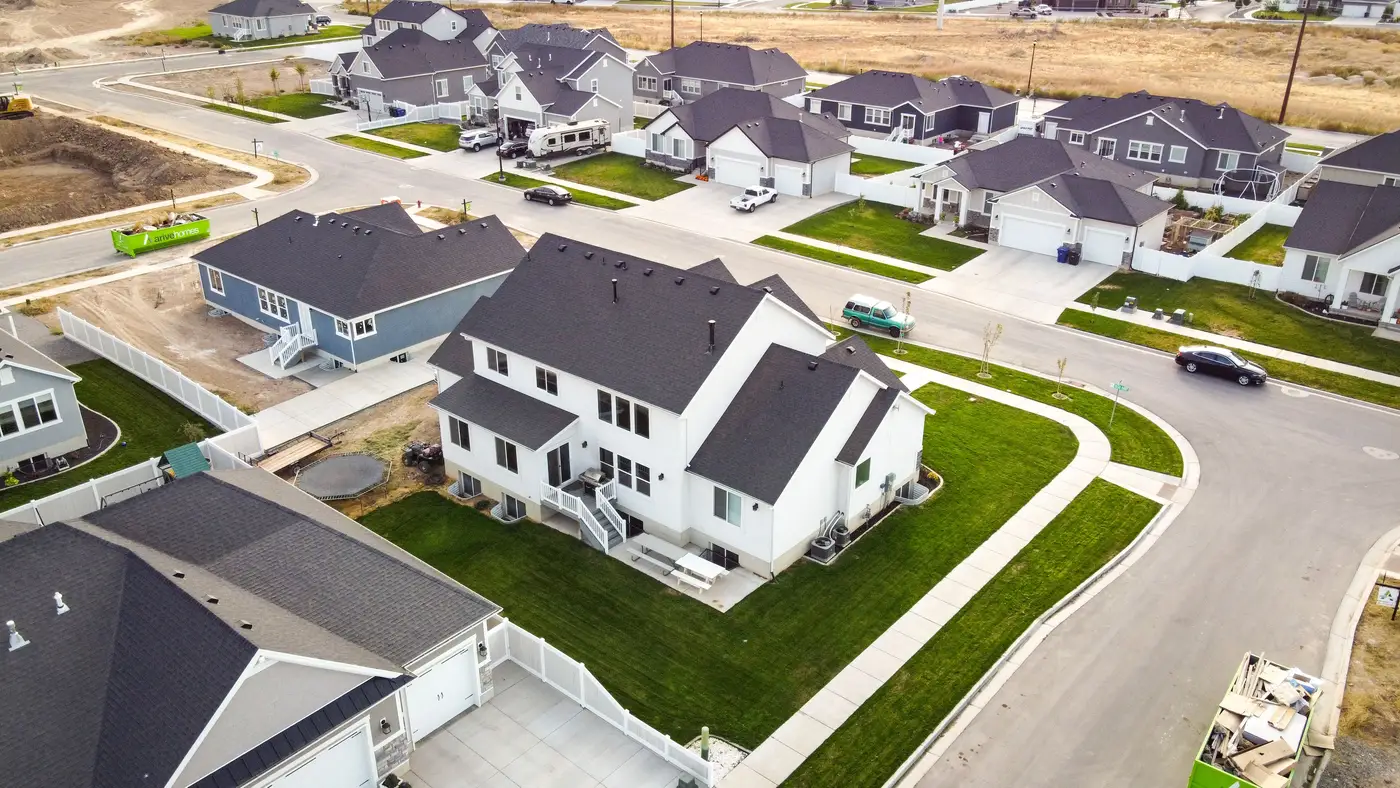
Growth happens in two geometries, and they leave very different traces in high-resolution imagery. A peri-urban fringe expanding into farmland adds footprint: new roads, new parcels, new single-storey or two-storey structures spreading outward. A built-up core infilling adds height instead: existing plots get redeveloped into three, five, eight storeys, often with the footprint staying flat or even shrinking as small adjoining plots get merged into one larger building.
Treat both as the same kind of growth and your estimate will drift, sometimes for years before anyone catches it.
Two signals, not one
A structure count on its own tells you how many buildings exist. It doesn't tell you whether those buildings got taller. A footprint layer tells you how much land is built up. It doesn't tell you how many households are stacked on that land.
Horizontal sprawl shows up as rising structure counts and rising footprint area, with building height holding close to baseline, often one or two storeys across informal or peri-urban settlement. Vertical infill shows up as flat or even falling structure counts (older low-rise buildings demolished and combined), flat or shrinking footprint, and rising building height.
A ward that looks stable on a structure-count proxy alone could in fact be the fastest-growing part of your district, just vertically. This is the failure mode that catches a lot of inter-censal projections built on permit data or footprint change alone: they assume horizontal growth is the whole story, because that was true at the last census, and in most peri-urban districts it still is, right up until a corridor near a new transit line or ring road starts going up instead of out.
Why the estimate changes, not just the map
The population math downstream of this is simple but unforgiving. You take a count of residential structures or dwelling units, multiply by an occupancy figure, and get a population. The occupancy figure for a single-storey compound house is not the occupancy figure for a six-storey apartment block. Use one blended average across both building types in a mixed district and you'll either overstate the sprawl fringe or understate the densifying core, depending on which one dominates your sample.
Infill development population density needs its own multiplier, separate from the fringe. A ratio method calibrated against the last census in a district that has since verticalized keeps applying an occupancy assumption that was true five or ten years ago to buildings that no longer stand in that form. Run the comparison the other way for a sprawl vs. densification census estimate and the error flips: apply high-rise occupancy figures to a fringe of single-storey plots and you'll overcount, sometimes badly.
What separates the two in practice
The only way to tell infill from sprawl without sending a field team out is to read footprint, structure count and building height together, for the same area, at the same time. Footprint growth with flat height is sprawl. Flat footprint with rising height is infill. Most districts are doing some of both, in different wards, during the same inter-censal period, which is exactly why one district-wide growth rate flattens out a pattern a ward-by-ward read would catch.
This vertical-growth-versus-footprint-growth distinction is the whole reason a single average density figure per structure rarely survives contact with a real district. The layer Population Estimation builds from high-resolution satellite imagery pulls structure counts, footprint area and a building-height read over your area of interest, so the densifying wards and the sprawling ones get assigned different occupancy assumptions instead of one blended guess.
If your last census predates the district's verticalization, or its outward spread, that's worth checking before the next projection round goes out.
Get in touch if you'd like to see what that split looks like for your district.