Top-down vs bottom-up population estimation: picking a method for a fast-growing district
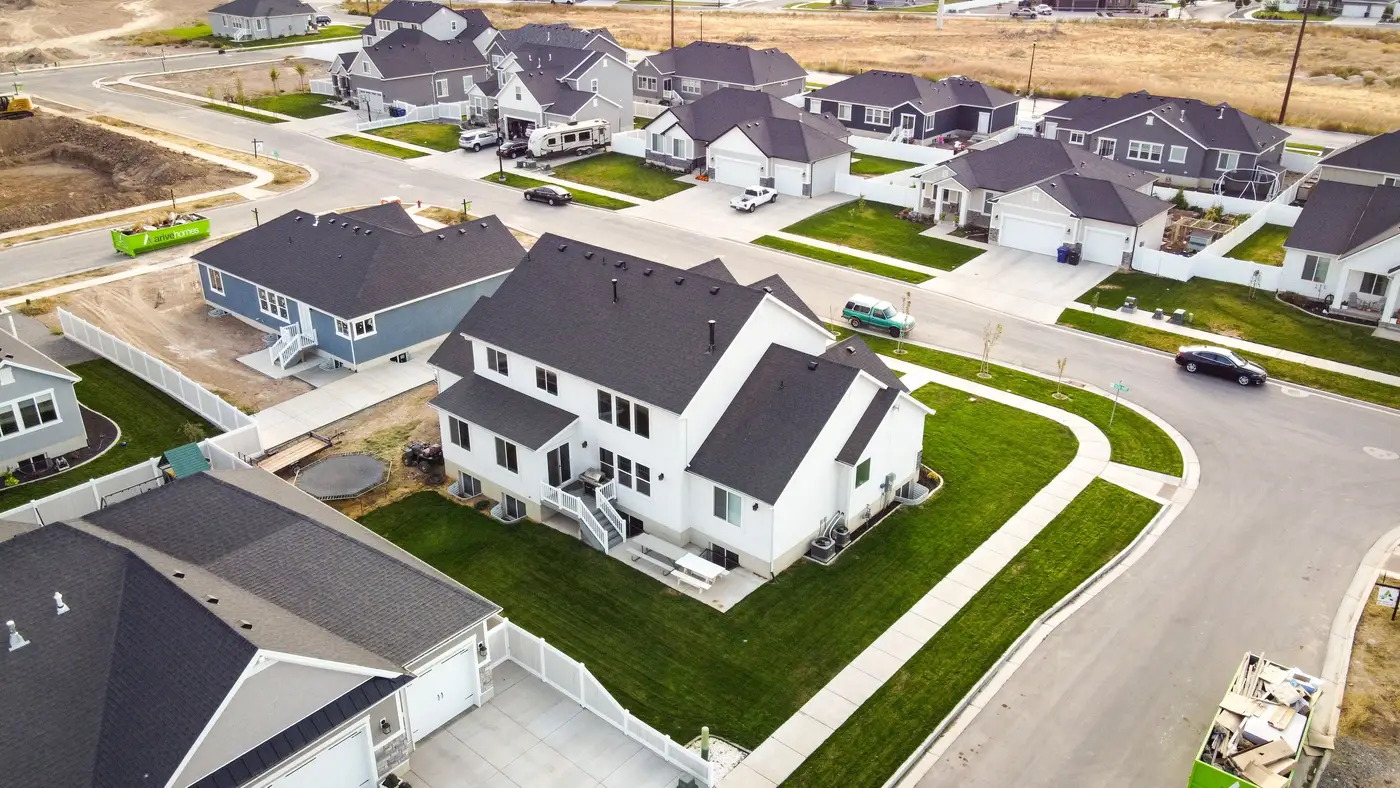
Every methods textbook sorts intercensal estimation into two families, and in practice the choice usually comes down to what data you can trust for the area you're estimating. Top-down methods start from a number you already believe (a national or provincial control total) and allocate it downward using some proxy that correlates with population. Bottom-up methods do the opposite: they build the estimate from the smallest unit up, usually a housing count, and sum to the district or tract.
Neither family is universally better. The textbook answer is "it depends on the indicators available," which is true but not very useful when you're staring at a district that added three new subdivisions since the last enumeration and your vital registration coverage for that district is patchy at best.
Top-down: ratio and symptomatic methods
The classic top-down tool is the ratio method: you take a symptomatic indicator, something that moves with population but is easier to measure than population itself, and compute its ratio to population in the last census year. School enrollment, registered voters, utility hookups and driver's license counts are the usual suspects. You update the indicator for the current year, apply the base-year ratio, and get an estimate. The ratio-correlation method is the regression cousin: instead of one indicator, you regress population on several symptomatic variables across all districts in a region and apply the fitted equation to your target district.
The weakness shows up exactly where you need the method most. A symptomatic indicator assumes the relationship between that indicator and population hasn't shifted since the base year. In a district absorbing new migrants and new construction, school catchment boundaries get redrawn, utility connection backlogs pile up, and voter registration lags behind actual residents by a year or two. A symptomatic indicator is only as current as its weakest proxy, and in a fast-growing district the proxy is usually the first thing to drift.
Bottom-up: the dwelling unit method and its data problem
The dwelling unit method (also called the housing unit method) works from the other direction. You count occupied housing units in the area, multiply by average household size, add an estimate of group-quarters population, and you have your total. It's the method most statistics offices reach for because the logic is transparent and defensible in a report: here's how many units, here's the occupancy rate, here's household size, here's the number.
The catch is that every term in that equation needs updating, and the unit count is usually the hardest one. A dwelling unit method is only as good as its structure inventory, and in a fast-growing district the structure inventory from the last field frame is already stale. New plots get subdivided, informal settlements expand past the old enumeration boundary, and nobody has re-walked the area to recount. Compared to the ratio method, the dwelling unit method trades "depends on a stable symptomatic relationship" for "depends on an up-to-date structure count." For a district where the structure count itself is the thing that changed, that's the bottleneck, not the arithmetic.
This is the gap a current, high-resolution building layer closes. Pulling a built-up area and structure count from recent satellite imagery, cross-checked with a building-height layer to separate single-story infill from new multi-unit blocks, gives the dwelling unit method an inventory that matches the ground as of this year rather than the last field round. Population Estimation builds that layer for a defined area of interest and hands back the structure count and built-up footprint a bottom-up estimate actually needs, without a door-to-door recount.
Which method fits the district in front of you
If your vital registration and symptomatic indicators are solid and stable, the ratio or ratio-correlation method needs only an updated indicator value and the base-year ratio, no new structure count. If the district's growth is structural, new land converted to housing, new subdivisions platted, informal expansion at the edge, the dwelling unit method needs a current structure count behind it, and the ratio method's base-year relationship probably no longer holds. Most statistics offices end up running both and triangulating, which works as long as the inputs to each round are fresh rather than carried forward from the last census frame out of convenience.
If the structure count is the part holding your estimate back, that's worth a conversation with Population Estimation.