How to estimate average household size when the census is old
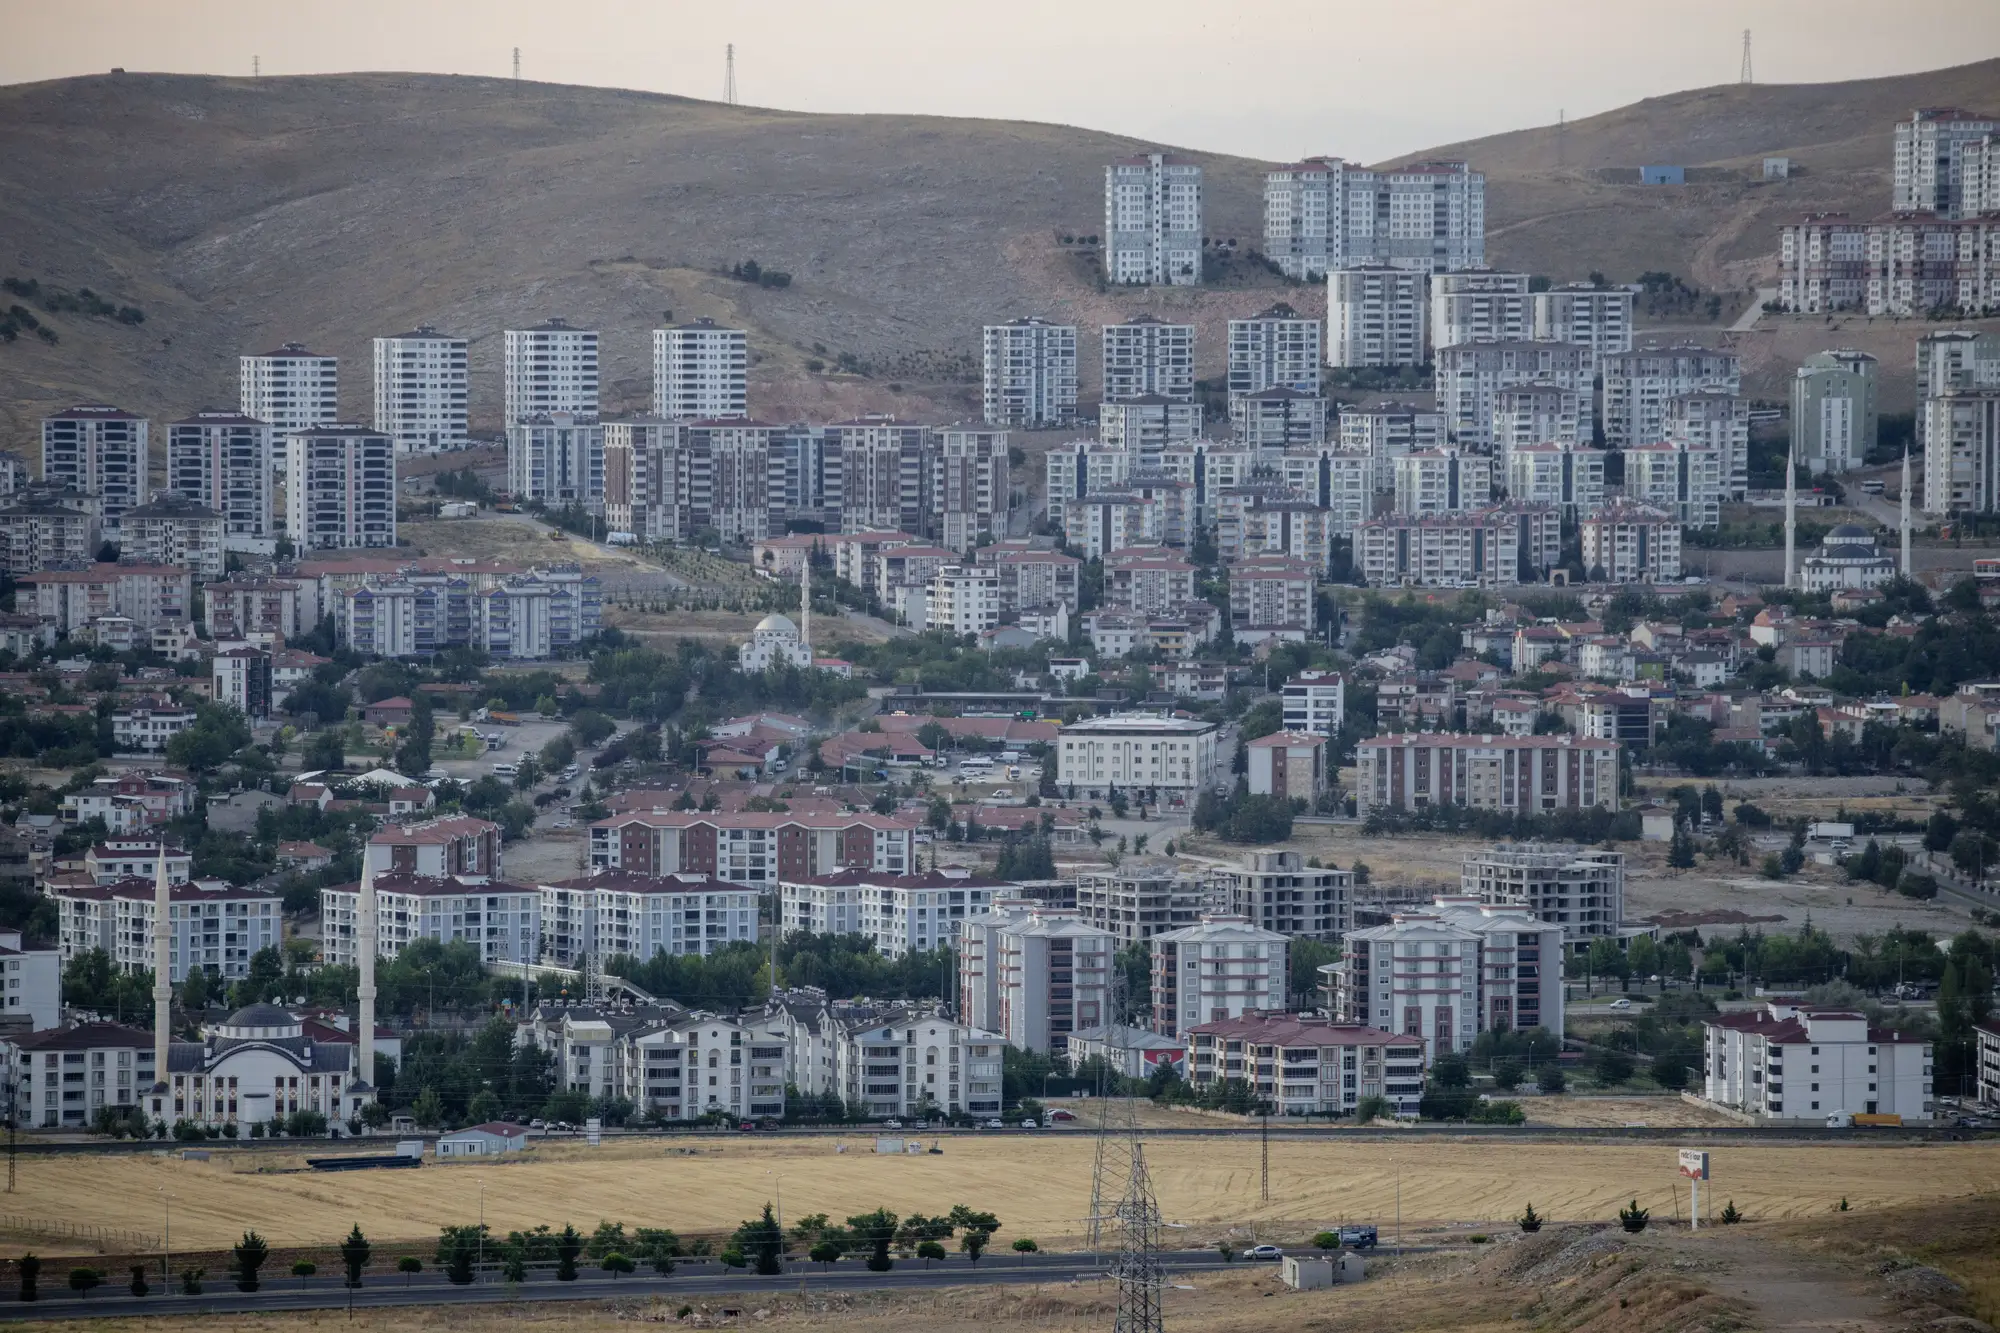
Most inter-censal population estimates still run on one equation: population equals the number of occupied housing units times average household size. The housing unit count can be refreshed from building permits, utility connections, or imagery. Average household size is the figure almost everyone just carries forward from the last census, unchanged, because there's no obvious replacement number sitting in a table somewhere.
That's the weak joint in the estimate. Household size doesn't hold still for a decade. It falls as fertility declines and young adults form their own households sooner. It can rise just as fast in a district absorbing migrants who double up in existing stock while new construction lags behind. If your last census was 2011 and you're estimating for 2024, treating that year's household size as still valid is an assumption, not a fact, and it deserves to be checked rather than inherited.
Why the household size assumption moves the whole number
Run the arithmetic on a mid-sized district. Say you've counted 40,000 occupied dwellings from recent imagery or administrative records. At a household size of 4.5, that's 180,000 people. Drop the assumption to 4.0, closer to what you'd expect after a decade of urbanization and smaller nuclear families, and you get 160,000. A 0.5-person swing in household size, well within the range you'd see between two census rounds in a fast-growing area, moves the population estimate by more than 10%. Planners sizing a water network or a vaccination campaign off that number will feel the difference.
This is why statistics offices that take inter-censal estimates seriously don't treat household size as a constant carried over from the last headcount. They treat it as a parameter that needs its own update path, separate from the housing unit count.
Methods for updating the figure
A few approaches, roughly in order of how much fieldwork they demand:
Trend extrapolation from two prior censuses. If you have household size for census year t-1 and t-2, the direction and rate of change between those two points gives you a defensible trajectory to extend forward. This works best where the demographic transition has been gradual and nothing has disrupted the pattern, like a large influx of displaced households or a wave of new informal settlement.
Administrative proxies. Voter registration rolls, school enrollment records, and utility billing data (especially electricity or water connections per address) can be cross-tabulated against known population figures from the last reliable survey to back out a current household size, or at least bound it within a plausible range.
Intercensal household surveys. A Demographic and Health Survey, Labour Force Survey, or Multiple Indicator Cluster Survey run in the years since the last census often asks household roster questions as a matter of course, even when population size isn't its primary purpose. These are usually the strongest available update, where they exist and cover your district.
Structural indicators. Where none of the above exist for a fast-growing district, a change in the ratio of new structures to new population can sometimes be inferred from building stock growth relative to known regional household formation rates, though this leans heavily on assumptions from comparable districts and should be flagged as such in any methodology note.
Whichever method you use, document the household size you assumed and where it came from. A reviewer or a successor analyst will ask, and "same as 2011" is not an answer that survives scrutiny for a district that's visibly changed.
Pairing household size with a current structure count
An updated household size figure is only half the equation. It still needs multiplying against a current, accurate count of occupied structures, and that count is exactly where a lot of inter-censal estimates go stale, since nobody re-surveys housing stock between census rounds. Population Estimation builds that second half from recent high-resolution satellite imagery, turning a built-up area, a structure count, and a building-height layer into the housing-unit side of the equation, so your updated household size assumption gets paired with a number that reflects what's actually been built, not what was standing a decade ago.
If you're assembling an inter-censal estimate for a district that's grown since the last count, it's worth seeing what that structure layer looks like for your area.