Field notes: the ward where the building count outran every growth assumption we had
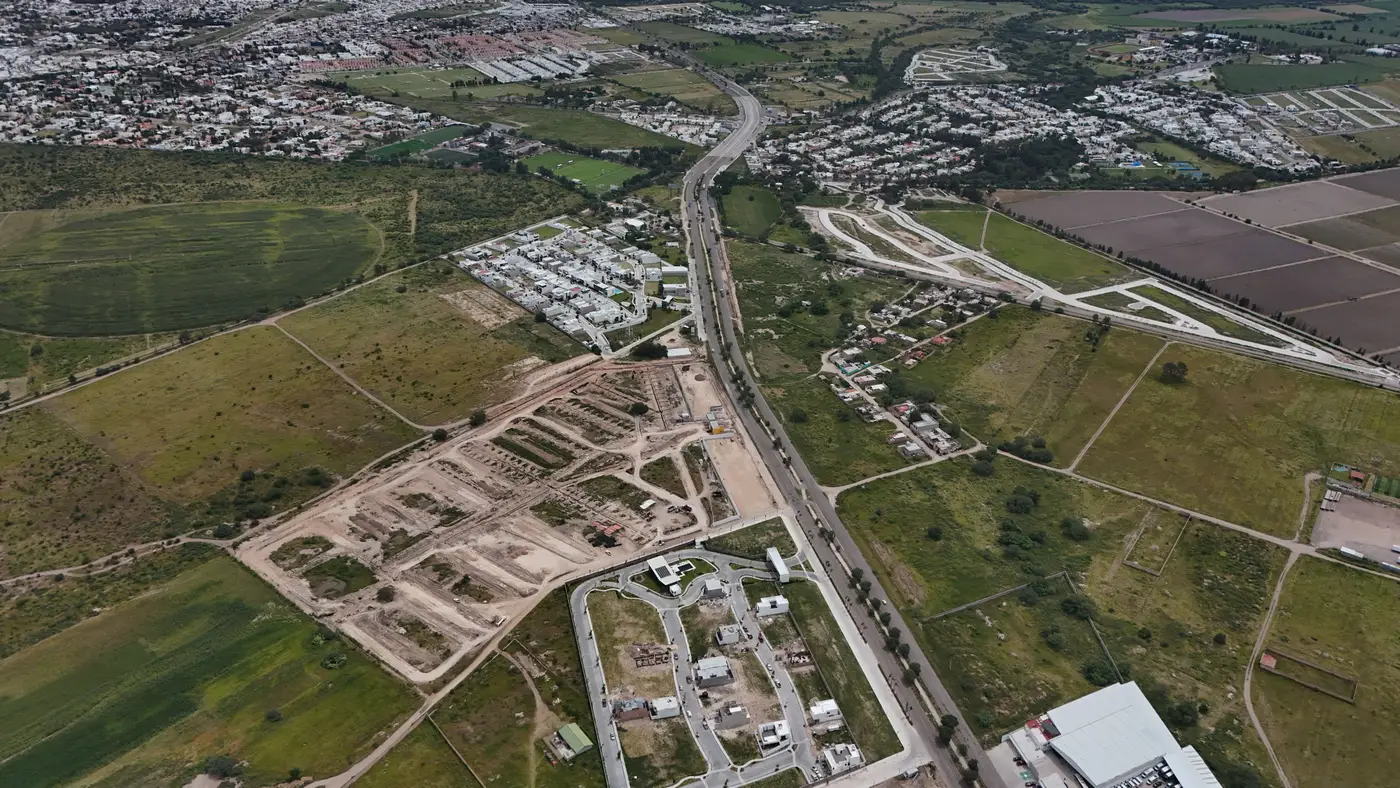
We'd budgeted two days for the update. Pull the last census count for the ward, apply the national intercensal growth rate, round sensibly, move to the next ward on the list. That's the job most months. Then we got to the ward on the edge of the city, the one with the informal transport depot and the new ring road spur, and the number refused to behave.
The last census had it at just under 14,000 people. The standard growth rate for that region, compounded out to the current year, put it at roughly 19,500. A reasonable number. A defensible number, the kind you can write into a planning document without anyone in the room asking hard questions.
Then someone pulled a structure count off recent high-resolution imagery for the same boundary, mostly out of curiosity, because the ward had come up in a land-use dispute and we wanted a footprint layer anyway. The structure count had gone from roughly 2,100 buildings at the last census to just over 5,400. Not a modest overshoot. Two and a half times the structures, against a population projection that assumed something closer to 1.4 times the growth.
The instinct is to distrust the imagery. New builds often sit empty for a season before occupancy, so a raw structure count can run ahead of real population. We checked that first, looked at building height where we could get it, looked for half-finished shells versus roofed and evidently lived-in structures. Most of what we were counting wasn't speculative. It was small, single-story infill on plots that used to be garden land, the kind of growth that happens one household at a time and never makes it into a planning ministry's five-year projection because nobody applied for a permit.
What had actually happened, as far as we could reconstruct it, was that the ring road spur had made the ward commutable to two industrial estates that previously required a two-hour trip. People moved in ahead of any formal subdivision, ahead of any utility connection, ahead of anything that would have shown up in administrative records before the next count. The national growth rate, built from a blend of fertility, mortality and net migration assumptions averaged across a much larger region, had no way to see a single road project changing one ward's trajectory mid-decade.
This is the structural problem with intercensal estimates in places growing unevenly: the growth rate you're applying was fitted to the country, or at best the province, and you're asking it to describe a patch of land that might be doing something completely different. It works fine for the stable wards, the ones where last year looks like next year. It fails for the wards driving most of the city's growth, which are exactly the ones where the planning questions (schools, clinics, water pressure) are most urgent.
The structure count worked as a flag: a reason to go back to that ward specifically instead of trusting the regional multiplier, and eventually a second input weighed against the demographic model. We ended up presenting both figures to the planning office with the gap explained, which is a more honest position than handing over a single number and letting them assume it was measured rather than modeled.
We've started running a structure-and-height pass over every ward flagged as high-growth before we finalize the intercensal figures, to check the demographic method against what's on the ground. If you're doing this work and want to see how that kind of built-up-area and structure-count layer gets built for an area of interest, the walkthrough on Population Estimation's intercensal estimate page covers it in more detail than I can here.
Next time the regional growth rate and the building count disagree by that much, we're not waiting for the dispute hearing to notice.